With methane science evolving rapidly, this edition of our research digest highlights six new studies that refine how emissions are measured and managed. This includes: OGI survey performance, methane intensity metrics, LiDAR-based basin inventories, wind-dependent detection limits, MethaneSAT super-emitter mapping, and satellite estimated flaring.
Taken together, these findings suggest integration of ground, aerial, and satellite data is necessary for credible methane accounting.
Real World Performance of Regulatory OGI Surveys Likely Overestimated
Three years of regulatory LDAR survey data in British Columbia, Canada is analyzed and compared to source resolved aerial surveys. This research notes discrepancies and discusses concerns regarding overestimation of emissions mitigation from OGI based LDAR surveys:
- Aerial surveys suggest true emissions may be at least 4x higher than suggested by LDAR surveys
- Regulated OGI surveys only capture a small portion of total emissions
- AVO surveys are “wholly ineffective”
Ground surveys and aerial surveys tend not to capture the same sources: aerial is dominated by larger emissions from combustion, vent, and fugitives, and LDAR detections are dominated by smaller leaks from connectors and valves
LDAR and Aerial surveys are described as complementary, and the authors recommend combining both to get a more complete picture of total emissions. Wilde, S. E., Tyner, D. R., & Johnson, M. R. (2025). The Efficacy of Methane Leak Detection and Repair (LDAR) Programs in Practice. ACS ES&T Air.
Different Formulas for Methane Intensity: Pros and Cons
Six predominant methane intensity metrics are analyzed. Due to naïve attribution of methane loss strictly to gas production, three of these metrics are found to have limited practical utility, especially in oil dominant operations. The remaining three metrics compare methane loss to the combined energy of oil and gas and are described by the authors as “broadly applicable”. These are:
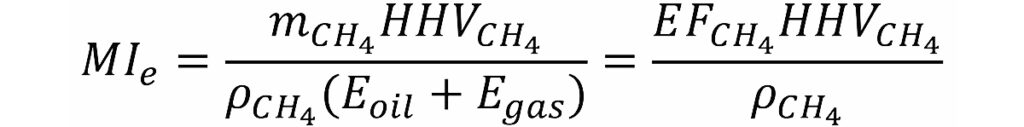
- Methane Emission Factor [g/MJ]. “Mass of emitted methane per marketed energy.”

- Methane Energy Intensity [%]. “Energy of emitted methane per marketed energy.”
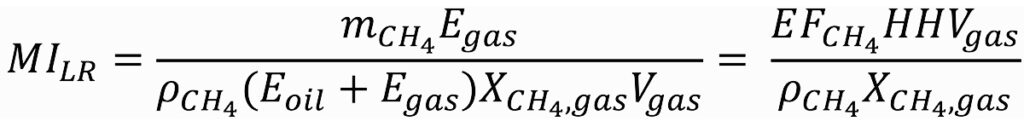
- Methane Intensity true Loss Rate [%]. “Emitted methane from gas per methane in marketed gas.”
This work strongly recommends transparent reporting of production volumes, heating values, methane fractions and methane emission totals used in calculations.
Bridger Data Estimates 3.13% Methane Loss Rate in Permian Basin
Quarterly aerial LiDAR scans are used to present a source-resolved methane inventory for the Permian basin. Deploying Bridger’s GML to over 50,000 sites over four quarters, an average 90% PoD of 1.16 kg/h was achieved. This work reports a basin wide loss rate of 3.13%, where Texas’s Permian loss rate is 3.6% (4038 kt CH₄) and New Mexico’s Permian loss rate is 2.1% (1,095 kt CH₄). The authors note this is near New Mexico’s 2026 target of 2.0%. This study finds that most large operators outperformed the basin-average intensity, attributing this to newer facilities, higher production, and active LDAR programs. The results and methods from this study are put forward as a credible baseline for benchmarking and a transferable framework for OGMP 2.0 Gold Standard reporting.
Aerial Methane Detection Limits Strongly Affected by Wind Speed
A method for developing a practical detection limit for aerial emissions surveys is applied to Permian datasets. This work shows that wind speeds may have a stronger impact on detection limits than what is predicted by controlled release testing results. For a wind speed increase from 2 to 10 m/s, this work found the detection limits increased by up to three times for AVIRIS-NG and two times for Bridger GML. The authors estimate that under varied field conditions, up to 18% of emissions may be missed; they caution of a systematic underestimation of low-magnitude emissions in field campaigns.
MethaneSAT reveals High Concentration of Permian Super-emitters in the Midland Sub-basin
The MethaneSAT (March 2024-June 2025) mission’s capabilities are showcased, with an estimated detection limit of 500 kg/h; however, this limit is for idealized conditions and MethaneSAT was found to be much more sensitive to windspeed than higher resolution technology.
“Particularly strong and persistent” super-emitters are observed in Turkmenistan’s South Caspian basin, and the US Permian basin. The authors note that although Permian super-emissions were previously dominated by the Delaware sub-basin, this has shifted to the Midland sub-basin during the MathaneSAT mission. This work additionally flags major super-emissions in the Maturin (Venezuela), Zagros Foldbelt & Widyan (Iran) and Appalachian basins.
Flaring in Canada Likely Underestimated by VIIRS Satellite
Twelve years of satellite data from the Visible Infrared Imaging Radiometer Suite (VIIRS) instrument is analyzed. This research found that VIIRS methods consistently estimated lower flaring volumes than industry data in Canada. For example, operators reported 2.2 times more flaring than estimated with VIIRS data in 2023. This discrepancy is attributed to small or intermittent flares (below 220 kg/methane/h), enclosed combustor use, and frequent cloud cover. The authors suggest that smaller flares may be detectable with improved data processing and controlled release testing.